Creating More Housing Choices in Our Communities - It's Good for All of Us
There is a housing affordability crisis throughout the state, including in rural communities like Hebron, Marlborough, Andover and Columbia. This affects everyone, including young professionals, seniors and working families.
Because of rising housing costs, a lack of housing choices (especially affordable housing), and stagnant or slow-growing wages, many health care workers, first responders, teachers, retail and restaurant workers, and others are not able to live in the town where they work.
When the local workforce can’t find housing they can afford, the entire community suffers. Research shows that having access to affordable, stable housing in good neighborhoods is associated with positive health, education and economic outcomes for individuals and families. But having a sufficient supply of housing affordable to households all along the income spectrum is also critical to supporting vibrant and sustainable local economies.
The Problem:
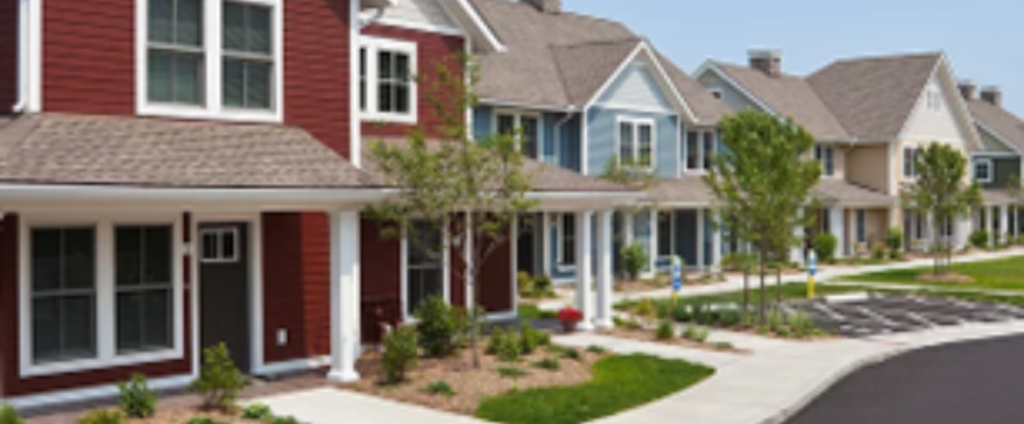
Less than three percent of Hebron’s housing is deemed affordable (four percent in Andover and two percent in Marlborough and Columbia). The vast majority (90 percent) of the housing in these towns are single-family homes, meaning there are very few apartments available for those who can’t afford to, or don’t want to, live in a house.
Between 21 and 26 percent of the households in these four towns are cost-burdened – meaning they spend more than 30 percent of their income on housing. For renters in our communities, the percentage is as high as 67 percent.
A lack of housing options also contributes to the lack of diversity in these towns.
Creating More Housing Options Will:
- Enable more people who work here to live here if they choose. This includes essential workers (like teachers and teacher’s aides, first responders, health care aides, bus drivers, and retail workers).
- Help people stay in a community they love as their housing needs change over their lives. This is especially true for seniors who may find themselves unable to afford or maintain their large home.
- Allow our children and grandchildren, who may be currently priced-out, to live here.
- Help existing businesses. When town residents spend less on housing costs, they can spend more at local businesses.
- Attract new businesses. The new knowledge-based economy looks for a diverse workforce in affordable, walkable communities. These new businesses would provide new jobs, increase spending in our local economy, and create a more vibrant community.
- Begin to increase diversity in our community by enabling more families and individuals with less resources to live here, including those who have been unable to accumulate wealth because of decades of exclusionary policies and practices.
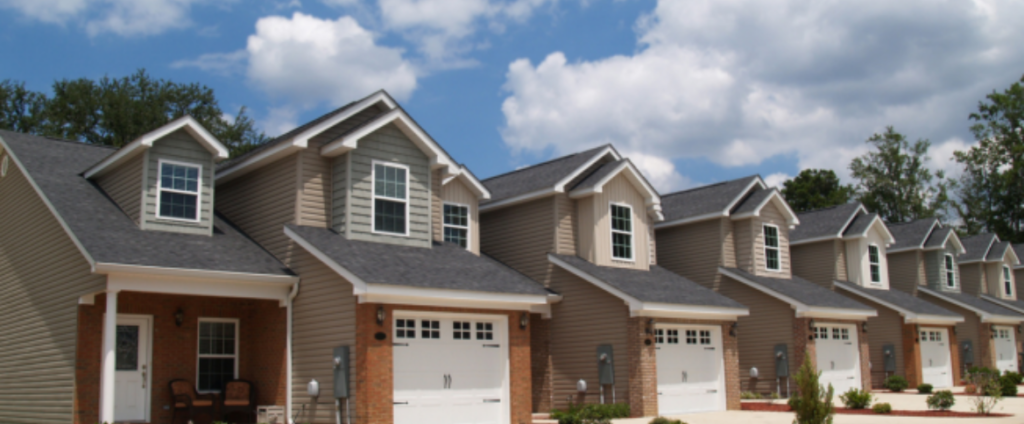
- Make Hebron more environmentally sustainable. Compact, village scale, multi-family homes will reduce the pressure to build houses on large lots and gobble up our valued farmland and forests.
Who Lives in Mixed-Income/Affordable Housing
Myths and Facts
Resources and More Information